Services
Offshore Site Assessments throughout Alaska
Watson Company Inc. is an organization dedicated to providing our clients with highly skilled and professional
marine geophysical, oceanographic and hydrographic services.
Our services include data acquisition, interpretation, remote logistics, reporting and mapping.
Please contact us in Anchorage or Homer with questions you may have about your project.

Offshore services
Geoscience information is required to assess and determine a location’s engineering acceptability and feasibility. Assessment of the site requires integration of information from several technical disciplines. We can generate a complete site assessment data set that includes sub-seafloor geophysical data, seafloor features and materials identification, depth data, oceanographic data and geotechnical sampling.
Watson Company Inc's geophysical data acquisition programs are adapted according to each client’s application, but generally include multi-channel seismic data, seafloor feature and hazard mapping and hydrographic data. WCI has completed over 100 site clearance, pipeline route, and outfall investigation surveys in our 30 years in Alaska.
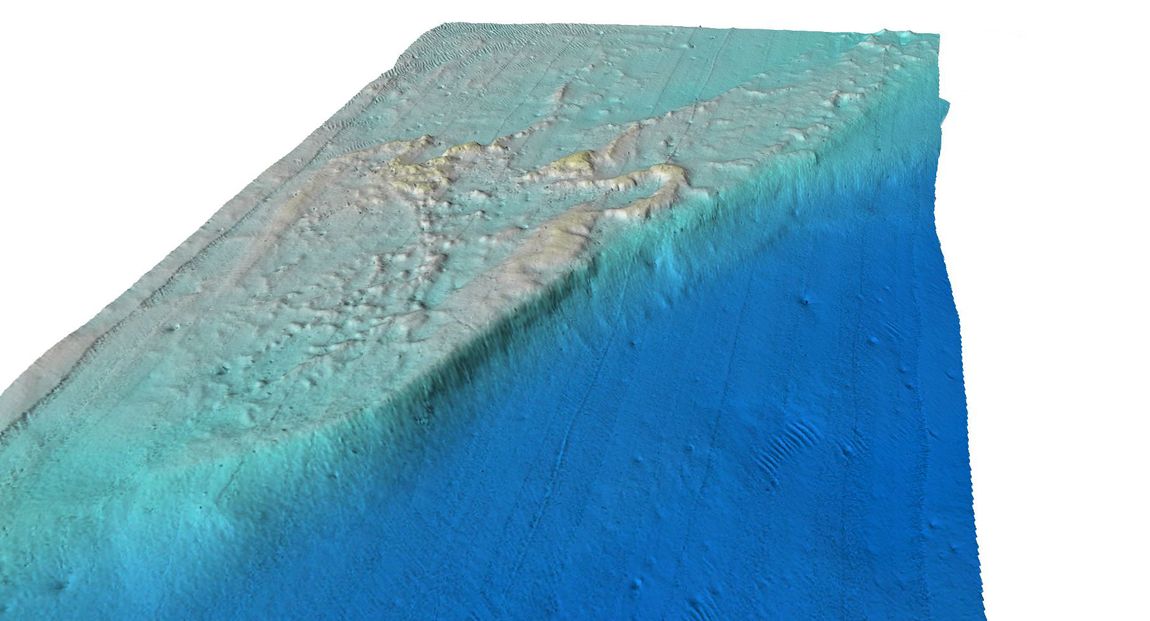
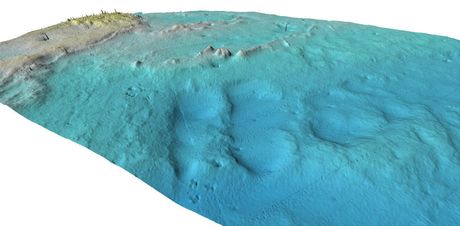
Subsequent to data acquisition, we process and analyze the sub-bottom data, and create seafloor mosaics and 3-dimensional models, and integrate the various data sets into a GIS database.
We provide logistical support for all our field programs. Proper logistics execution is a key to factor for every Alaskan offshore survey. Project management includes the preparation, planning, mobilization and contingency plans which often includes having 100% spares on board the survey vessel.
Watson Company Inc's geophysical data acquisition programs are adapted according to each client’s application, but generally include multi-channel seismic data, seafloor feature and hazard mapping and hydrographic data. WCI has completed over 100 site clearance, pipeline route, and outfall investigation surveys in our 30 years in Alaska.
Subsequent to data acquisition, we process and analyze the sub-bottom data, and create seafloor mosaics and 3-dimensional models, and integrate the various data sets into a GIS database.
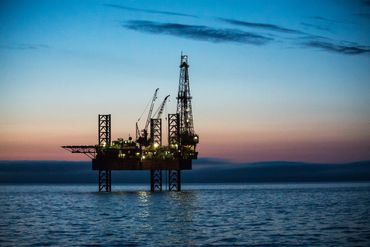
Our investigations for oil & gas geohazard site clearance include high-resolution geophysical data acquisition, data interpretation and reporting. We typically assist our client in meeting State of Alaska and Federal Outer Continental Shelf permitting.
We provide logistical support for all our field programs. Proper logistics execution is a key to factor for every Alaskan offshore survey. Project management includes the preparation, planning, mobilization and contingency plans which often includes having 100% spares on board the survey vessel.

Analysis and Interpretation
Our team has developed advanced data processing techniques that allow survey data to be presented in concise and straight forward formats, thereby maximizing its usefulness. Below are descriptions and examples of the products.
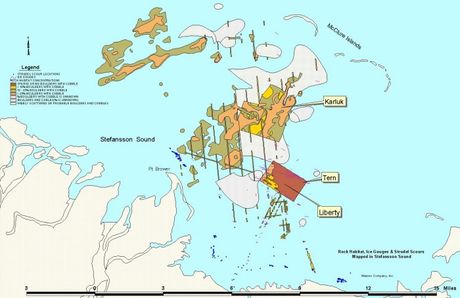
GIS Feature Charts
Present information based on data interpretations from the sub-bottom data, side scan sonar, bathymetry, and regional information gleaned from other sources for the area. Sub-bottom and seafloor data is classified based on geological stratification, reflectivity characteristics, water depth, gradient, and information obtained from geotechnical sampling. Features such as ridges, scarps, ice gouging, active bed forms and potential habitats can be indicated on the charts. Features of particular importance to the client are highlighted and mapped. The locations of existing shoreline and planned structures are shown on the charts when available.
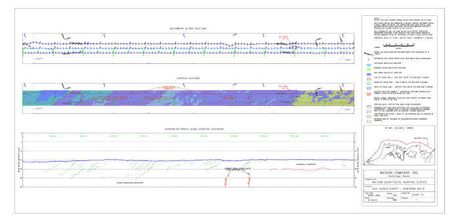
Geophysical Data Integration
Assist clients in reviewing site conditions for large or complex survey areas. Chart layouts can have multiple strips of different types of data, for example, bathymetry, seafloor material types, and sub-bottom data. Each data set is laid out across the page and indexed geographically to the data set below it on the page, in a series of panels. The organization of the panels typically has the bathymetry on top with the track-line information. The second panel includes information from seabed data, including seafloor features and seafloor reflectivity gleaned from the side scan sonar data. Surficial features such as boulders and anomalous features from the seismic data are generally included on the second panel. The third panel includes a profile interpretation of geologic stratigraphic reflectors from the sub-bottom data, and an integrated bathymetric profile.
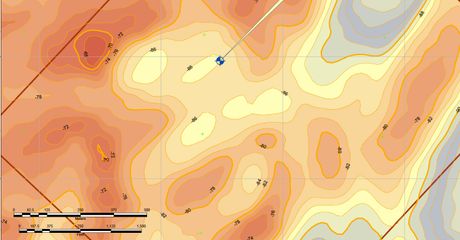
Bathymetry Charts
All depth contours and are corrected for sound speed variations in the water column and reduced to the local tidal datum. The bathymetric contour intervals are dictated by bathymetric coverage.
------------------------------------------
Watson Company Inc can generally provide clients with survey results in standard digital formats along with bound reports with accompanying maps and seismic sections. Digital versions of all reports are available as Adobe Acrobat .pdf files and Excel files. Charts are available as AutoCad .dxf .dwg, ArcView *.shp and Adobe Acrobat .pdf files.
GIS Feature Charts
Present information based on data interpretations from the sub-bottom data, side scan sonar, bathymetry, and regional information gleaned from other sources for the area. Sub-bottom and seafloor data is classified based on geological stratification, reflectivity characteristics, water depth, gradient, and information obtained from geotechnical sampling. Features such as ridges, scarps, ice gouging, active bed forms and potential habitats can be indicated on the charts. Features of particular importance to the client are highlighted and mapped. The locations of existing shoreline and planned structures are shown on the charts when available.
Geophysical Data Integration
Assist clients in reviewing site conditions for large or complex survey areas. Chart layouts can have multiple strips of different types of data, for example, bathymetry, seafloor material types, and sub-bottom data. Each data set is laid out across the page and indexed geographically to the data set below it on the page, in a series of panels. The organization of the panels typically has the bathymetry on top with the track-line information. The second panel includes information from seabed data, including seafloor features and seafloor reflectivity gleaned from the side scan sonar data. Surficial features such as boulders and anomalous features from the seismic data are generally included on the second panel. The third panel includes a profile interpretation of geologic stratigraphic reflectors from the sub-bottom data, and an integrated bathymetric profile.
Bathymetry Charts
All depth contours and are corrected for sound speed variations in the water column and reduced to the local tidal datum. The bathymetric contour intervals are dictated by bathymetric coverage.
------------------------------------------
Watson Company Inc can generally provide clients with survey results in standard digital formats along with bound reports with accompanying maps and seismic sections. Digital versions of all reports are available as Adobe Acrobat .pdf files and Excel files. Charts are available as AutoCad .dxf .dwg, ArcView *.shp and Adobe Acrobat .pdf files.
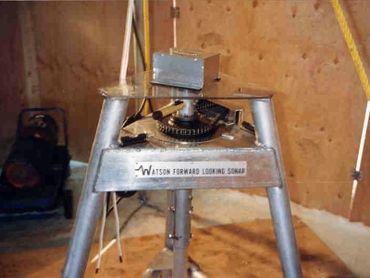
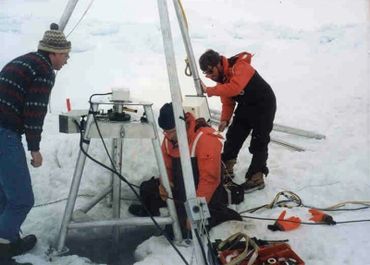
Watson Forward Looking Sonar
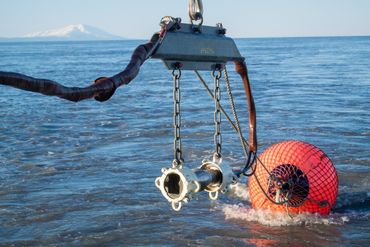
The Watson Forward Looking Sonar (WFLS) System was developed to fulfill the market need to collect extremely high quality sonar imagery and precision depth data over the ice. An automated rotating platform tripod assembly with heading and tilt sensor mechanisms allow for the acquisition of high quality sonar imagery, as well as precise depth data using interferometric techniques. The WFLS sonar imagery and bathymetry data is acquired simultaneously .
The WFLS System
(Patent #5173882) was designed to collect data in harsh Arctic marine environments. This requirement led to the development of instrumentation that can withstand these conditions and can be operated in a straight forward manner by taking advantage of the sonars platform stability. The Watson Company Inc. technical approach required the design of a aluminum tripod structure as the main component of the system, so that the sonar array orientation and stability could be established.
For WFLS System orientation a precision heading sensor and an optical level is used for the exact orientation of the sonar transducers. To index the WFLS System to a given bearing, the visual level is sighted at a survey monument. A compass rose with 360 increments for individual degrees in a circle, is located on the tripod table. The compass rose can be manually adjusted, and is used to ground truth the output of the heading sensor.
For practical operation the range scale of the sonar is variable from 25 meters to 200 meters. The rotation rate is slowed for distant ranges, and sped up for close range data acquisition.
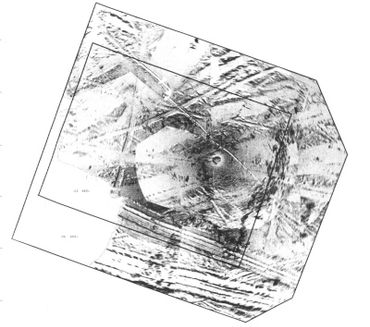
Data products generated from WFLS include electronic sonar mosaics shown to the left. Ice gouges are apparent in the mosaic shown to the left.